Where Are We Now with Housing: December 2018
Ken Johnson, Ph.D.
Florida Atlantic University
Twitter: @FAUHousingEcon
12-19-2018
Cycles clearly now exist in residential housing prices. It is also generally held
that we are nearing the peak of the current residential housing cycle. This is best
evidenced by the fact that property prices around the country are increasing but at
a decreasing rate, i.e. property appreciation is slowing.
This report investigates and compares the current status of U.S. housing, on a national level, with that of housing at the peak of the last cycle. Understanding where housing stands today relative to the last cycle’s peak creates more informed real estate consumers and perhaps a less bumpy ride this time around as the nation enters another housing cycle peak.
Two recent indices (Core-Logic Case Shiller and the Beracha, Hardin and Johnson Buy versus Rent Index) have advanced our understanding of housing prices and the demand for homeownership.
Repeat Sales Indices (Pricing Trends)
Core-Logic Case-Shiller is a repeat sales index that allows us to see the short-term direction of housing prices. While the methodology for the index is shared in many publications, Case and Shiller (1989) provides what many believe to be the best recap of how the index is estimated. This powerful tool and its derivatives reveal short-term housing price movements and are readily available to real estate consumers. One open/free source for nationwide housing prices is FRED, which provides Core-Logic Case-Shiller’s 20-City Composite index. With this index, real estate consumers can see the recent and past direction of housing prices.
Exhibit 1
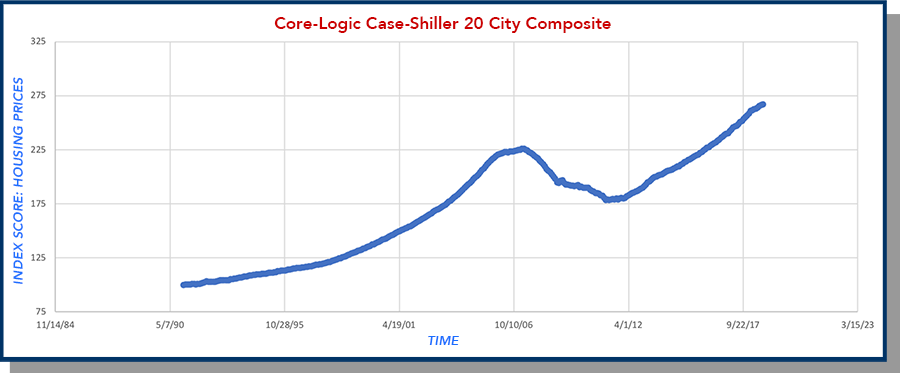
Exhibit 1 traces out the Core-Logic Case-Shiller’s 20-City Composite repeat sale index from
1987 to today. The index scores track housing prices and can be viewed as the typical
house in terms of an index score that reflects the short-term direction of housing
prices. Clearly, short-term prices have been trending upwards lately. The weakness
of Core-Logic Case-Shiller's 20-City Composite index (and all repeat sale indices
for that matter) is that it does not provide any direct evidence on the demand for
homeownership.[i] These indices only tell you where housing prices are currently located
relative to immediate past prices. Thus, it is hard to tell when housing prices will
begin to trend in another direction, i.e. fall or rise.
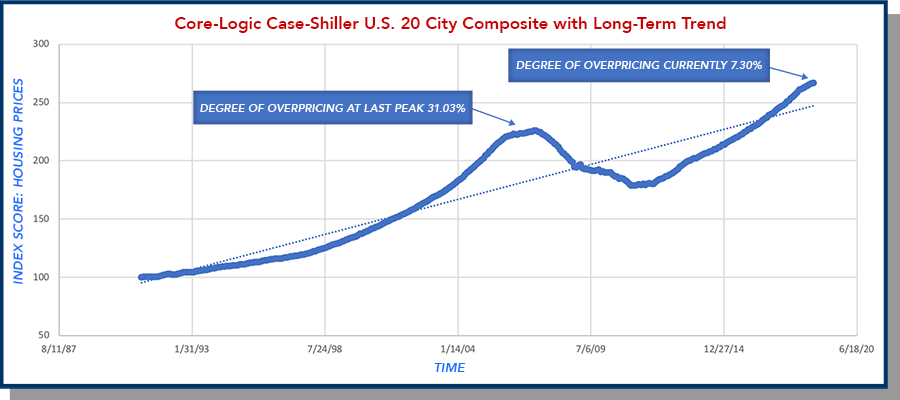
A long-term trend in national housing prices can be derived from the short-term index scores. This is done by determining the linear trend through the data. In Exhibit 2, the long-term pricing trend for national housing prices is revealed by the dotted, blue line. Monthly index scores are traced out in dark blue. Differences in short-term prices and the long-term pricing trend for housing can be calculated. This calculation reveals the degree of over/under pricing from the long-term trend. For example, in July of 2006 (at the peak of the last cycle) housing was 31.03% above its long-term pricing trend. Today, the index score is once again above the long-term trend but only by 7.30%.
Exhibit 2
BH&J Index (Pressure on Demand for Homeownership)
The Beracha, Hardin and Johnson Buy versus Rent Index (BH&J Index) is also open source and freely available to consumers of real estate. The index measures wealth creation in terms of homeownership and equity buildup versus renting a comparable home and investing rent differentials (the difference between the cost of homeownership and the cost of renting) in a portfolio of stocks and bonds. Beracha and Johnson (2012) outlines the methodology for producing the index.
The BH&J Index covers 23 of the nation’s largest metro areas and provides a composite of the national market as well. Two significant pieces of information are provided to consumers of real estate by the BH&J index. First, the index tells real estate consumers in terms of wealth creation if, on average, they would be better off owning and building equity or renting and investing in a portfolio of stocks and bonds. Second, by default, BH&J is an equilibrium model between renting and owning and as such provides direct evidence of pressure on the demand for homeownership. The index is calibrated so that scores approaching +1 indicate strong downward pressure on the demand for homeownership, which should induce a pricing downturn. Scores approaching -1 indicate strong upward pressure on the demand for homeownership, which should induce a pricing upturn. A score of 0 indicates no abnormal pressure on the demand for homeownership.
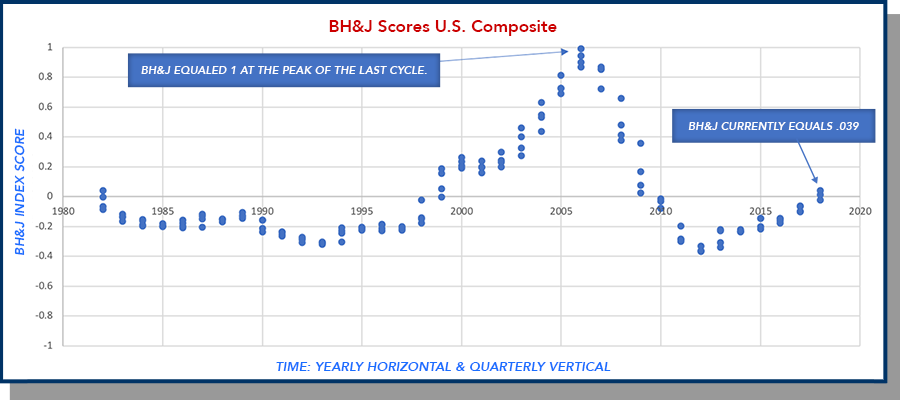
Exhibit 3 below provides BH&J scores for the U.S. through time. Each year contains four quarterly scores highlighted in blue. During volatile years all four blue-dots are visible, signaling an increasing probability that the existing short-term trend in housing prices, since the last peak or bottom of the cycle, is expected to continue.[ii] Additionally, BH&J scores approaching +1 are shortly followed by declines in housing prices. This can be seen by comparing 2006 BH&J scores from Exhibit 3 with Core-Logic Case-Shiller scores from Exhibit 1.
Exhibit 3
Where are we now?
Housing price data from Core-Logic Case-Shiller currently indicates that property appreciation is slowing around the country, which suggests that the U.S. housing market is reaching the peak of its current cycle. So, what is next?
Housing cycles are a relatively new phenomenon. Thus, what is going to happen next is difficult to determine. However, we can get some idea of what comes next by comparing the degree of overpricing from the peak of the last cycle and BH&J scores during the last housing cycle’s peak with today’s results. Table 1 provides a quick comparison. All values are provided either by the BH&J quarterly report or are calculated from raw Core-Logic Case-Shiller scores for the periods in question.
Table 1: National Scores – Degree of Over Pricing and BH&J Index Scores
| Degree of Over Pricing | BH&J Index Scores | |
| Last Cycle Peak | 31.03% | 1.00 |
| Today | 7.30% | .039 |
At the peak of the last cycle, housing prices on a national level were significantly
(31.03%) above their long-term pricing trend and the BH&J Index was indicating extreme
(1.00) downward pressure on the demand for homeownership, resulting in a dramatic
(27.4%) drop in prices between 06 and 12.
Today, assuming we are nearing the peak of the current housing cycle, national prices are only 7.30% above their long-term pricing trend and the BH&J Index score is .039 suggesting that national housing prices as a whole are only slightly overheated and are experiencing only minimal downward pressure on the demand for homeownership.
Key Takeaways
Many individuals will interpret these results differently. However, it seems clear that this time around (at least on a national level), the coming downturn will not be as dramatic as the last.Two caveats, however, are worth mentioning:
- First, national results of the degree of overpricing and BH&J scores reflect an accumulation of all the data; however, some cities (Dallas and Denver, in particular) standout with dramatic overpricing and extremely high BH&J scores. These metros are almost certainly facing significantly different outcomes than the US housing market as a whole.
- Second, an open question of contagion exists. That is, could crumbling housing markets in some few cities negatively impact the entire nation?
References
Beracha, Eli and Ken H. Johnson, Lessons from Over 30 Years of Buy versus Rent Decisions: Is the American Dream Always Wise? Real Estate Economics, 2102, Vol 40:2, pages 217 – 247.
Case, K.E. and Robert Shiller, The Efficiency of the Market for Single Family Homes. American Economic Review, 1989, Volume 79:1, pages 125-37.
Endnotes
[i] Core-Logic Case-Shiller and the Federal Housing Finance Agency both provide repeat sales indices for many housing markets around the country.
[ii] Volatility in BH&J scores appear to be greater at the peak of any given real estate cycle than at the bottom of each cycle.