Where are Housing Prices in Southeast Florida: A Current Evaluation
Denise Gravatt, DBA
Florida Atlantic University
Eli Beracha, Ph.D.
Florida International University
Ken H. Johnson, Ph.D.
Florida Atlantic University
3-22-2021
Near record low mortgage rates appear to be the proximate cause of the continued rise in housing prices around the nation. This trend is true for Southeast Florida. This report specifically seeks to determine if the current housing market in Southeast Florida is above or below its long-term fundamental pricing trend and to what degree, if any. As with prior reports and analysis presented by FAU's Real Estate Research Initiative, this report aims to provide information to real estate consumers, local real estate professionals and policy makers who can then make better informed real estate decisions.
Old and New Data
Some changes (i.e. data source and methodology) have been made since our last report and will be incorporated in periodic reports going forward. Prior data was collected from the Federal Housing Finance Agency (FHFA) on a quarterly basis and consisted of all transactions across the tri-county area (West Palm Beach, Broward, and Miami-Dade). While useful, given a paucity of data, inherent problems exist within the FHFA data and methodology. First, the data was only available on a quarterly schedule with a two-month lag. Therefore, market updates could only be produced every three months with a significant lag. To be optimally useful, updates need to be more current and regularly reported. Second, the data included all properties, resulting in the inclusion of transactions from both the lower-end and higher-end market segments. Transactions from these segments, while allowing for completeness, make it more difficult to accurately extract long-term pricing trend because of their price volatility.
We are, therefore, switching to another primary data source. For this report and going forward, we will employ open-source data from Zillow. The specific primary data employed is the Zillow Home Value Index (ZHVI). This measure is a smoothed and seasonally adjusted housing index that is reported monthly with a three-week lag. The ZHVI does not include the tails of reported transactions. Instead, it only reports closings in the 35th to 65th percentile range, which allows for a more accurate estimate of any local housing price trend.[i] The ZHVI has been reported monthly since January of 1996, which is a sufficiently long enough time span for trend development.
Once the data is secured, we estimate via a logarithmic fit a housing price trend. This trend is employed to estimate a current ZHVI (housing price estimate), which is compared to the current actual ZHVI. From there, a Premium/Discount for a given market is calculated.
Modeling
Using ZHVI scores, a simple Housing Index (HI) time trend can be developed from the primary data:
HIt = β0+β1xt+εt
(I)
Here t represents the numeric month for data with t = 1 representing January 1996 and xt is a time trend code in terms of months.
The HI estimation equation provides for the development of a fundamental long-term pricing trend based on over 25 years of data:
E(HIt) = β0+β1xt.
(II)
Here E(HIt) is the expected HI or ZHVI.
The degree that a local housing market is above or below its fundamental long-term pricing trend can then be calculated. Since the data is available monthly, the calculation is as follows:
Degree Above or Below Market Pricingt = ((Actual ZHVIt - E(HIt)) / (E(HIt)) (III)
Equation III is the percentage difference between where housing prices should be and the market’s actual scores at time t. Positive values for III represent a degree of overpricing while negative values represent a degree of underpricing.[ii]
Results for Southeast Florida Housing Market - March 2021
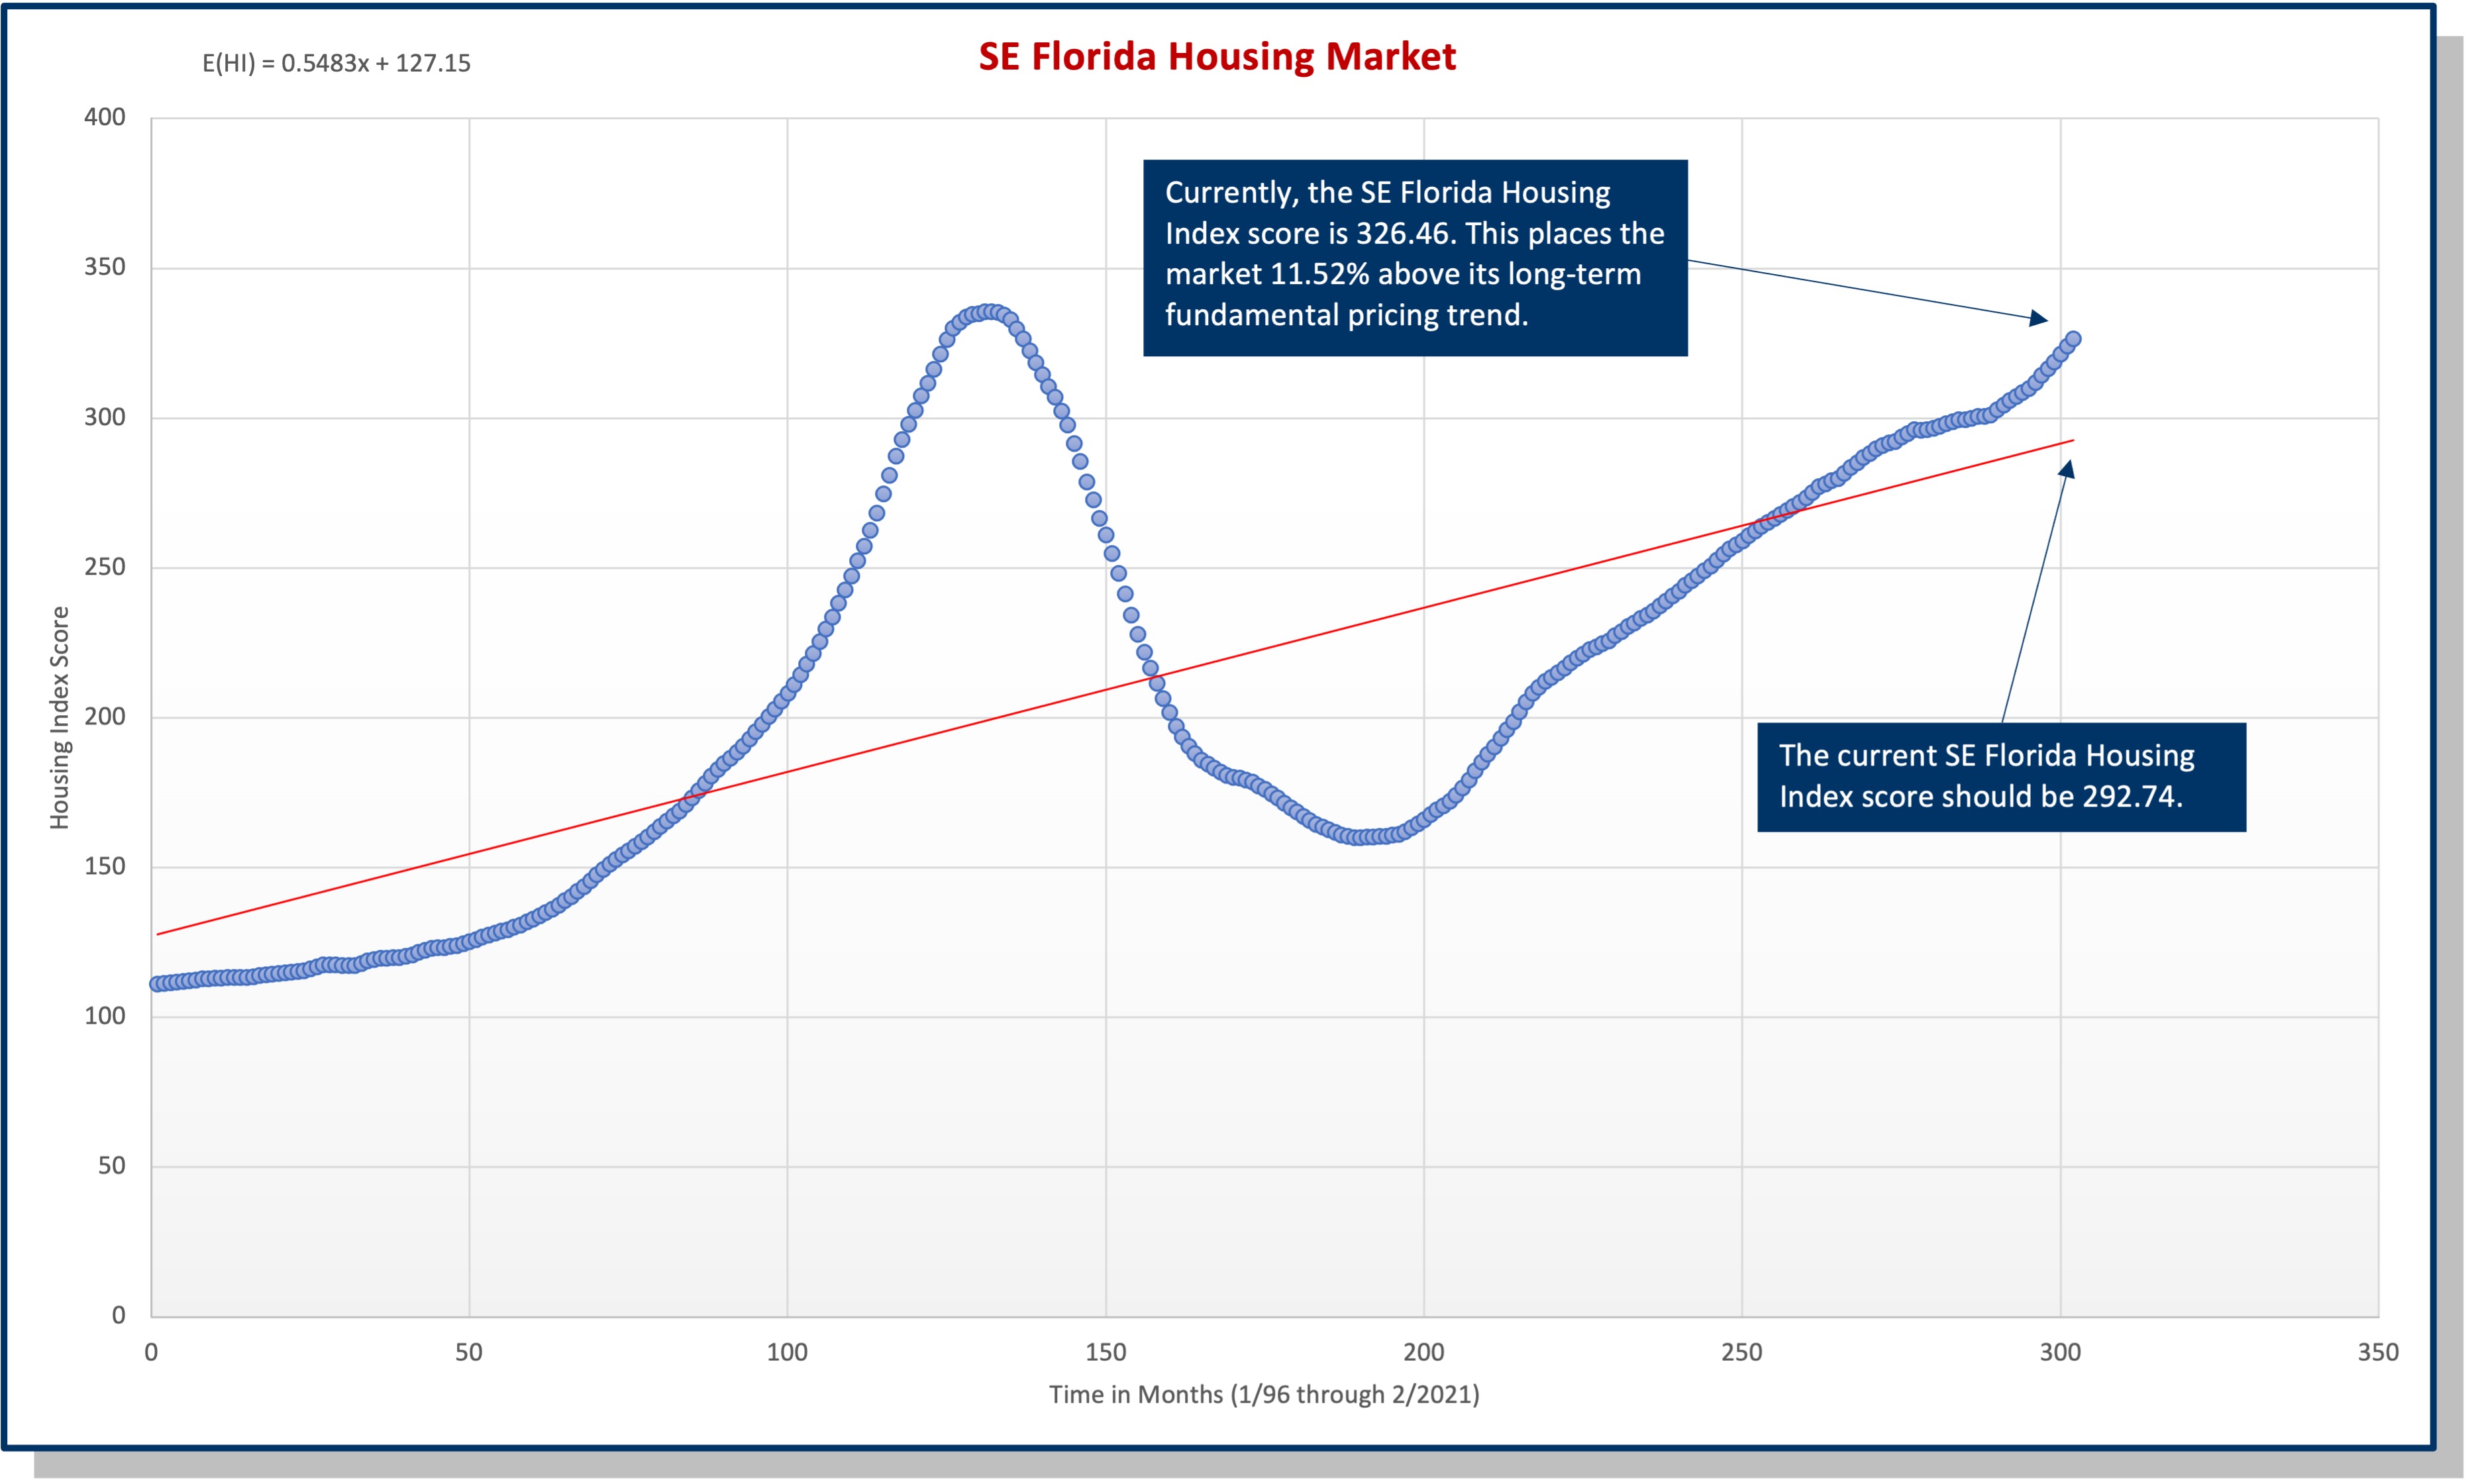
Executing on equations I through III reveals that the current Southeast Florida housing market is 11.52% above its fundamental long-term pricing trend. Figure 1 below depicts this value and traces out a history of actual ZHVI scores as well as their linear trend, E(HIt), which is the fundamental long-term housing price trend referenced above.

In Figure 1, the long-term fundamental pricing trend is depicted by the upward sloping linear trend highlighted in red. Actual housing index scores for the market are illustrated by scores traced out in blue.
Summary
As in other U.S. housing markets, prices in Southeast Florida cycle around a long-term fundamental pricing trend. The questions at hand are as follows:
- Is the market currently above or below its long-term fundamental pricing trend?
- To what degree (percentage) is the market currently above or below its long-term fundamental pricing trend?
An examination of Figure 1 clearly indicates that the Southeast Florida housing market is, in fact, currently above its trend. Employing Equation (III), we can calculate the degree of overpricing from the market’s trend.
Key Takeaways
Currently, the average home in the Southeast Florida housing market is 11.52% above its long-term pricing trend.
The availability of this information should help all with interests in Southeast Florida real estate - consumers, professionals and policy makers - to make more informed real estate decisions.
Endnotes
[i] One modest tradeoff is made, however, between the use of FHFA and ZHVI data as the primary source. The FHFA data can be disaggregated by county – Miami-Dade, Broward and Palm Beach. The ZHVI data cannot be disaggregated, making individual county estimates impossible.
[ii] Beyond the scope of this particular market update, a regularly provided index reporting a market’s degree of above or below long-term fundamental pricing can be developed for numerous housing markets around the country.